Below is a data‑driven summary of today’s gold market, drawing on the latest central bank forecasts, official demand figures, and institutional price targets.
📈 Executive Summary Gold is in a tug‑of‑war between short‑term macro headwinds – a strong US dollar, higher real yields and the delayed Fed easing – and long‑term structural support from sustained central bank buying and a historic shift in the composition of physical demand. In Q1 2026 the value of global gold demand soared 74 % to a record US 193 𝑏 𝑖 𝑙 𝑙 𝑖 𝑜 𝑛 , 𝑤 ℎ 𝑖 𝑙 𝑒 𝑖 𝑛 𝑣 𝑒 𝑠 𝑡 𝑚 𝑒 𝑛 𝑡 ‑ 𝑔 𝑟 𝑎 𝑑 𝑒 𝑏 𝑎 𝑟 𝑠 𝑛 𝑜 𝑤 𝑜 𝑢 𝑡 𝑝 𝑎 𝑐 𝑒 𝑗 𝑒 𝑤 𝑒 𝑙 𝑙 𝑒 𝑟 𝑦 𝑓 𝑎 𝑏 𝑟 𝑖 𝑐 𝑎 𝑡 𝑖 𝑜 𝑛 𝑓 𝑜 𝑟 𝑡 ℎ 𝑒 𝑓 𝑖 𝑟 𝑠 𝑡 𝑡 𝑖 𝑚 𝑒 𝑜 𝑛 𝑎 𝑚 𝑜 𝑑 𝑒 𝑟 𝑛 𝑠 𝑐 𝑎 𝑙 𝑒 . 𝐴 𝑓 𝑡 𝑒 𝑟 𝑎 14 193 billion,whileinvestment‑gradebarsnowoutpacejewelleryfabricationforthefirsttimeonamodernscale.Aftera14 5,600/oz, spot gold trades near US 4 , 530 – 4 , 610 / 𝑜 𝑧 , 𝑦 𝑒 𝑡 𝑚 𝑜 𝑠 𝑡 𝑙 𝑒 𝑎 𝑑 𝑖 𝑛 𝑔 𝑖 𝑛 𝑣 𝑒 𝑠 𝑡 𝑚 𝑒 𝑛 𝑡 𝑏 𝑎 𝑛 𝑘 𝑠 𝑠 𝑡 𝑖 𝑙 𝑙 𝑡 𝑎 𝑟 𝑔 𝑒 𝑡 𝑦 𝑒 𝑎 𝑟 ‑ 𝑒 𝑛 𝑑 𝑝 𝑟 𝑖 𝑐 𝑒 𝑠 𝑜 𝑓 𝑈 𝑆 4,530–4,610/oz,yetmostleadinginvestmentbanksstilltargetyear‑endpricesofUS5,000‑6,200/oz.
💰 Price & performance snapshot Metric Value Spot gold (May 18) ~US$4,534/oz Q1 2026 quarterly average US$4,873/oz 2026 high nearly US$5,600/oz (late January) YTD performance –14 % from the peak The LBMA PM gold price set a **new quarterly average record of US 4 , 873 / 𝑜 𝑧 ∗ ∗ 𝑖 𝑛 𝑄 1 , 𝑎 𝑛 𝑑 𝑡 ℎ 𝑒 𝑝 𝑟 𝑖 𝑐 𝑒 ℎ 𝑖 𝑡 𝑎 𝑛 𝑎 𝑙 𝑙 ‑ 𝑡 𝑖 𝑚 𝑒 ℎ 𝑖 𝑔 ℎ 𝑜 𝑓 𝑈 𝑆 4,873/oz∗∗inQ1,andthepricehitanall‑timehighofUS5,405/oz in January before a sharp correction. The pullback is largely macro‑driven: the Iran‑Hormuz shock pushed energy costs higher, fuelled inflation fears and caused markets to price out Fed rate cuts, lifting the dollar and real yields – the two main headwinds for non‑yielding gold.
🏭 Supply & demand breakdown (Q1 2026) Total demand – 1,231 t (+2 % y/y), but its value jumped 74 % to US$193 bn – the highest ever recorded.
Investment demand now far exceeds fabrication, a structural reversal that provides a more durable price floor than price‑elastic jewellery buying.
Segment Q1 2026 (tonnes) Change (y/y) Bar & coin demand 474 t +42 % (2nd‑highest quarter ever) Jewellery fabrication 335 t –23 % Technology 82 t +1 % (AI‑driven) Central bank net purchases 244 t +3 % Sources: World Gold Council, Metals Focus.
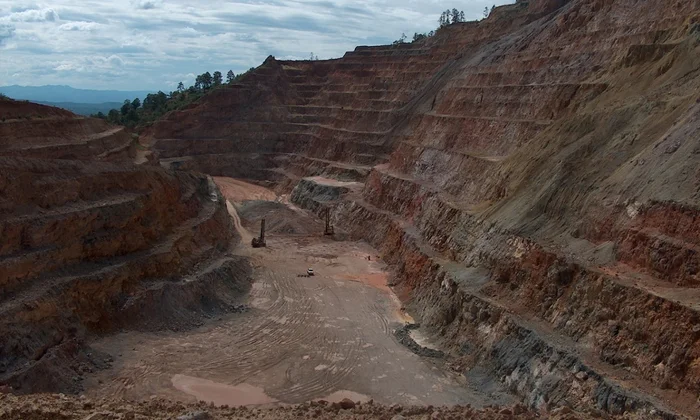
Supply rose only 2 % y/y to 1,231 t, with mine output at a record Q1 level of 885 t (+2 %) and recycling up 5 % to 366 t, as higher prices encouraged old‑jewellery sales. A modest supply response to skyrocketing demand value has kept physical premiums elevated.
🏦 Central banks – the “hidden” buyer Goldman Sachs has sharply revised up its estimate of central bank purchases after detecting a “data gap” in British trade statistics. Official buying was systematically under‑estimated since August 2025; after adjustment the 12‑month moving average of purchases stood at ~50 t/month in March, compared with the previous figure of only 29 t.


Goldman forecast: average monthly purchases of 60 t over 2026, underpinned by “strong underlying interest in gold” and a desire to diversify reserves in a fracturing geopolitical landscape.
World Gold Council (WGC): net purchases of 244 t in Q1, led by China (+8.1 t in April – 15th consecutive month), Poland (+31 t in Q1) and the National Bank of Poland (+20 t in February alone). Turkey was the largest seller (‑60 t) to shore up FX liquidity.
Wider buyer base: New or returning central banks – Guatemala, Indonesia, Malaysia – have entered the market, a sign that gold is gaining breadth as a reserve instrument.
📊 ETF & institutional flows Global gold ETFs recorded US$6.6 bn of inflows in April, reversing March outflows. Europe led the buying (fearing the Hormuz closure would hit the region hardest), followed by Asia and the US.
Comex managed money net long positions increased only modestly in April to US$1 bn (~5 t) and remain in “neutral territory,” leaving room to rebuild speculative length when the macro backdrop turns more gold‑friendly.
JPMorgan recently lowered its 2026 ETF inflow forecast to ~400 t (from 580 t), noting that investor interest has “dried to a trickle” and futures open interest is light. Yet global ETF holdings are still up 108 t year‑to‑date.
🎯 Institutional price forecasts (2026) Despite the near‑term correction, most major banks retain bullish year‑end targets, although there is considerable dispersion.
Institution Target (end‑2026) Core rationale Goldman Sachs US$5,400/oz 60 t/mo central bank buying + 50 bp Fed cuts + positioning normalisation UBS US$6,200/oz Low rates, currency debasement hedge JPMorgan US 6 , 000 / 𝑜 𝑧 ( 𝑦 𝑒 𝑎 𝑟 ‑ 𝑒 𝑛 𝑑 ) ; ∗ ∗ 𝑎 𝑣 𝑒 𝑟 𝑎 𝑔 𝑒 𝑐 𝑢 𝑡 𝑡 𝑜 𝑈 𝑆 6,000/oz(year‑end);∗∗averagecuttoUS5,243** from US$5,708 on weak near‑term demand ING US$5,000/oz Central bank buying + ETF inflows once the dollar weakens ANZ US$5,600/oz (lowered from earlier) Rising yields and persistent inflation expectations RBC Average US 4 , 600 / 𝑜 𝑧 𝑖 𝑛 2026 ; 𝑈 𝑆 4,600/ozin2026;US5,100/oz in 2027 Gradual demand recovery Goldman’s detailed model assigns: US 195 / 𝑜 𝑧 𝑓 𝑟 𝑜 𝑚 𝑠 𝑝 𝑒 𝑐 𝑢 𝑙 𝑎 𝑡 𝑖 𝑣 𝑒 𝑝 𝑜 𝑠 𝑖 𝑡 𝑖 𝑜 𝑛 𝑖 𝑛 𝑔 𝑛 𝑜 𝑟 𝑚 𝑎 𝑙 𝑖 𝑠 𝑎 𝑡 𝑖 𝑜 𝑛 , 𝑈 𝑆 195/ozfromspeculativepositioningnormalisation,US120 from the expected 50 bp of Fed cuts, and US$535 from the re‑acceleration of central bank buying to 60 t/month.
Downside scenario: a prolonged Hormuz closure and equity weakness could push gold as low as US$3,800/oz in a severe liquidation event.
Upside scenario: accelerated de‑Westernisation of reserves could send prices to US$5,700–6,100/oz.
⚠️ Key risks & catalysts to watch Risk Impact on gold Prolonged higher‑for‑longer Fed Keeps US dollar strong and real yields high, capping gold Liquidity‑driven selling Gold is highly liquid; in market stress it is often sold first to cover margin calls or other losses Strait of Hormuz resolution Would unwind inflation tail‑risks, weaken the dollar, and likely spark a recovery rally towards US$4,900‑5,100/oz Fed rate‑cut timeline A shift back to 50 bp of cuts (Goldman’s base case) would add ~US$120/oz to fair value Peace talks collapse Extends the energy‑shock regime, keeping real yields and the dollar elevated 🔮 Outlook summary Near‑term: Gold remains technically vulnerable, stuck between its 200‑day (~US 4 , 340 ) 𝑎 𝑛 𝑑 50 ‑ 𝑑 𝑎 𝑦 ( 𝑈 𝑆 4,340)and50‑day( US4,730) moving averages. The Fed’s “higher‑for‑longer” stance and the dollar’s strength are likely to keep prices in a range for the next 4‑6 weeks.
Medium‑term (2H 2026): Most analysts expect a recovery once the Hormuz situation is resolved (JPMorgan’s oil team expects a reopening in June). Lower energy prices would ease inflation, allow the Fed to cut rates, and unwind the dollar’s strength, triggering a rotation back into gold ETFs and Comex positioning.
Long‑term: The structural shift from jewellery‑led to investment‑led demand, combined with a broader base of central‑bank buyers (including new emerging‑market entrants), suggests a higher sustainable price floor than in previous cycles. Yet the pace of that re‑rating depends critically on when the energy‑shock backdrop gives way to a more traditional macro environment.